Family stats: lifespans, birth decades and a fan chart of descendants
How long did your great-grandparents live? Which decade had the most babies? Who had the most children, and how many descendants has Grandad got now? Your family tree can tell you. PeoplePlotr now works out a set of family stats from your story, with charts drawn in your tree's design, and a new Descendants section and fan chart for each person. You don't have to write anything new: if your story has the dates, the stats are already there.
The pictures here use the Hughes family, 24 people over five generations, starting with Arthur and Edna Hughes, who married in 1932.
About this tree
Click About this at the top of the tree. Under the title and your words about the family, you'll see four numbers: how many people are in the tree, how many generations, the average lifespan and the longest life. Below them is a small chart of how many people were born in each decade.
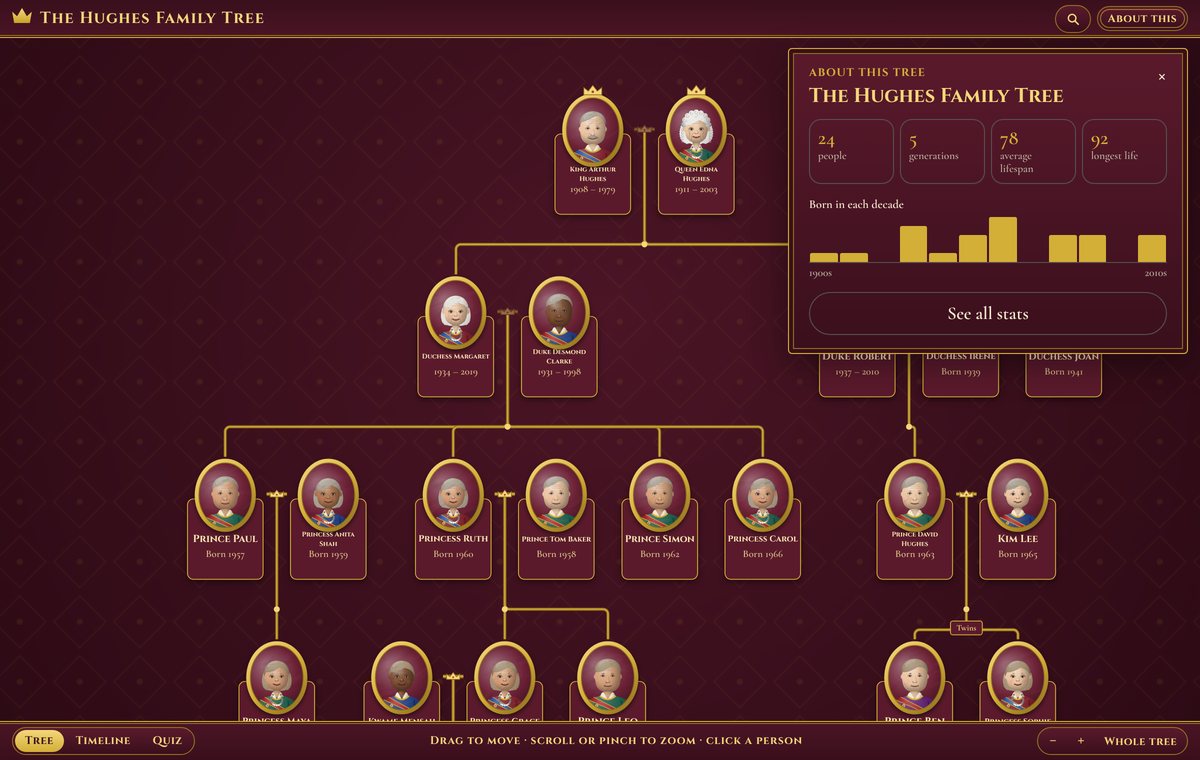
If you've written a lot about the family, a Family stats button at the top of the card takes you straight down to the numbers.
All the stats
Click See all stats and they fill the space where the tree was:
- People, with how many are living and how many are remembered, plus generations, couples, the average lifespan and the longest life, with whose it was.
- Born in each decade, from the oldest ancestor to the newest baby.
- Lifelines: the longest lives, drawn from birth to death along a line of years, so you can see whose lives overlapped.
- Age at death, by decade of life.
- Most children: who had the most children in the tree.
- Names used more than once, for the Arthurs, Marys and Johns who turn up again a generation or two later.
- Women and men, from the story, or guessed from names when the story doesn't say.
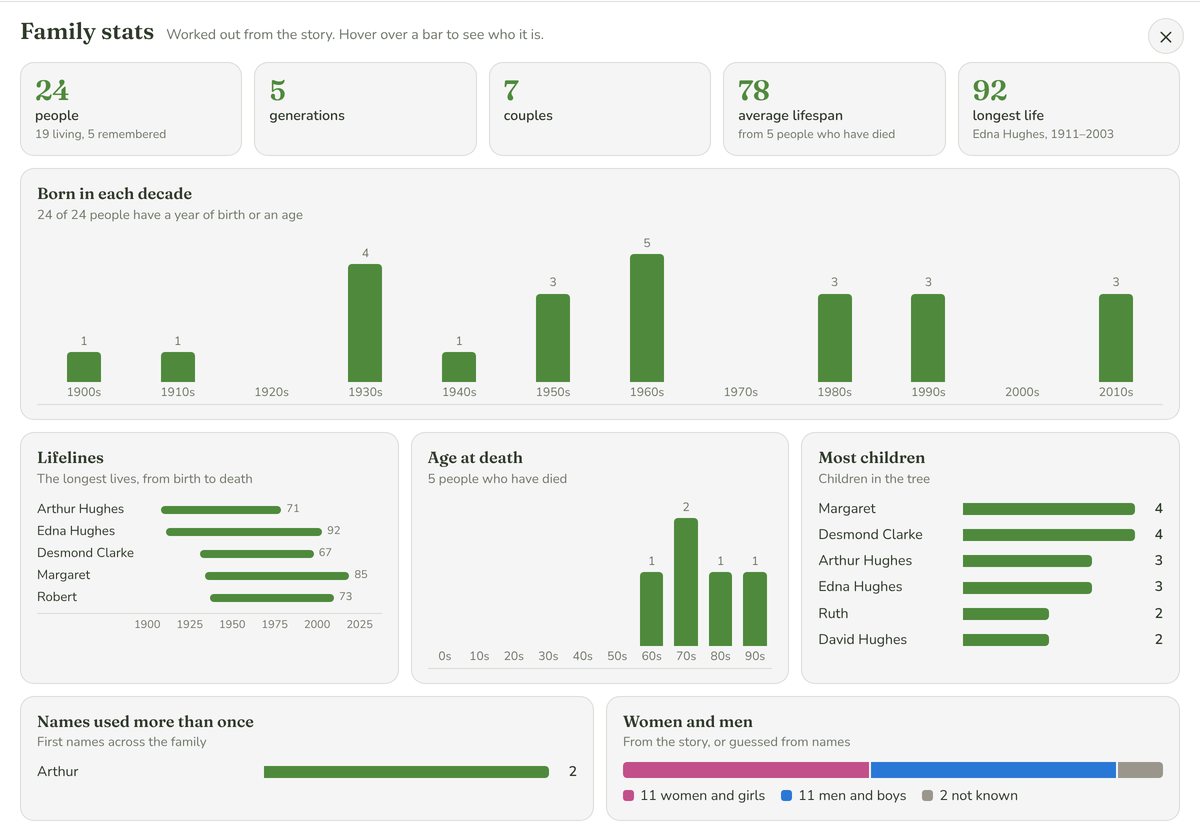
Hover over a bar to see who it is. Click a name and you're back on the tree with that person's details open. To go back to the tree, click × or press Esc.
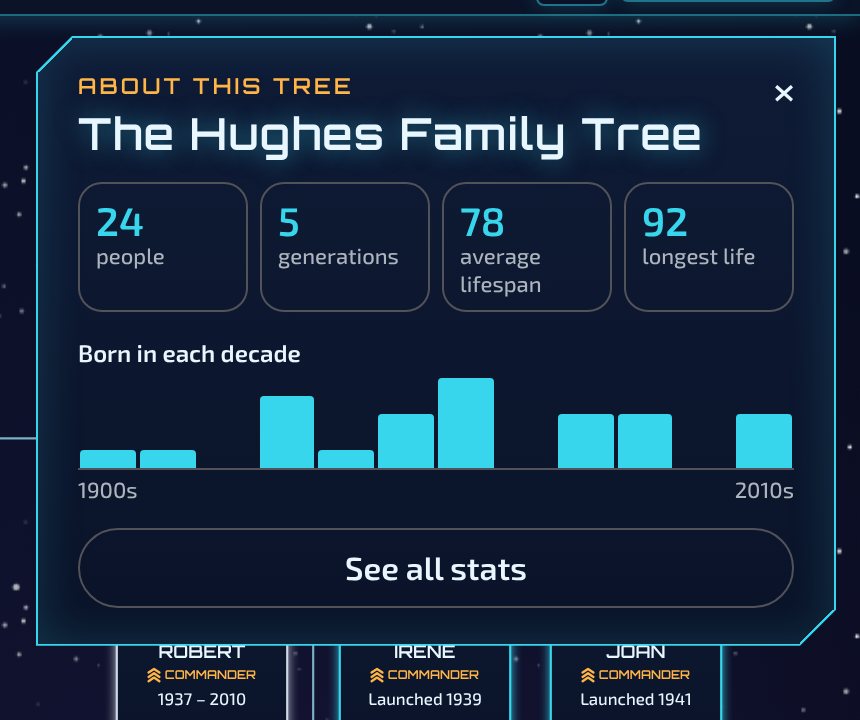
The stats are dressed to match your design: gold in Royal, neon blue in Space Crew, and so on through all the designs.
Descendants and a fan chart for each person
Click someone on the tree and their panel now has a Descendants section. It tells you how many descendants they have and over how many generations, with a bar for their children, grandchildren, great-grandchildren and so on. It also shows their eldest and youngest descendant, how many are girls and boys, and how many are living. A small half-circle fan chart shows how the family spreads out from them.
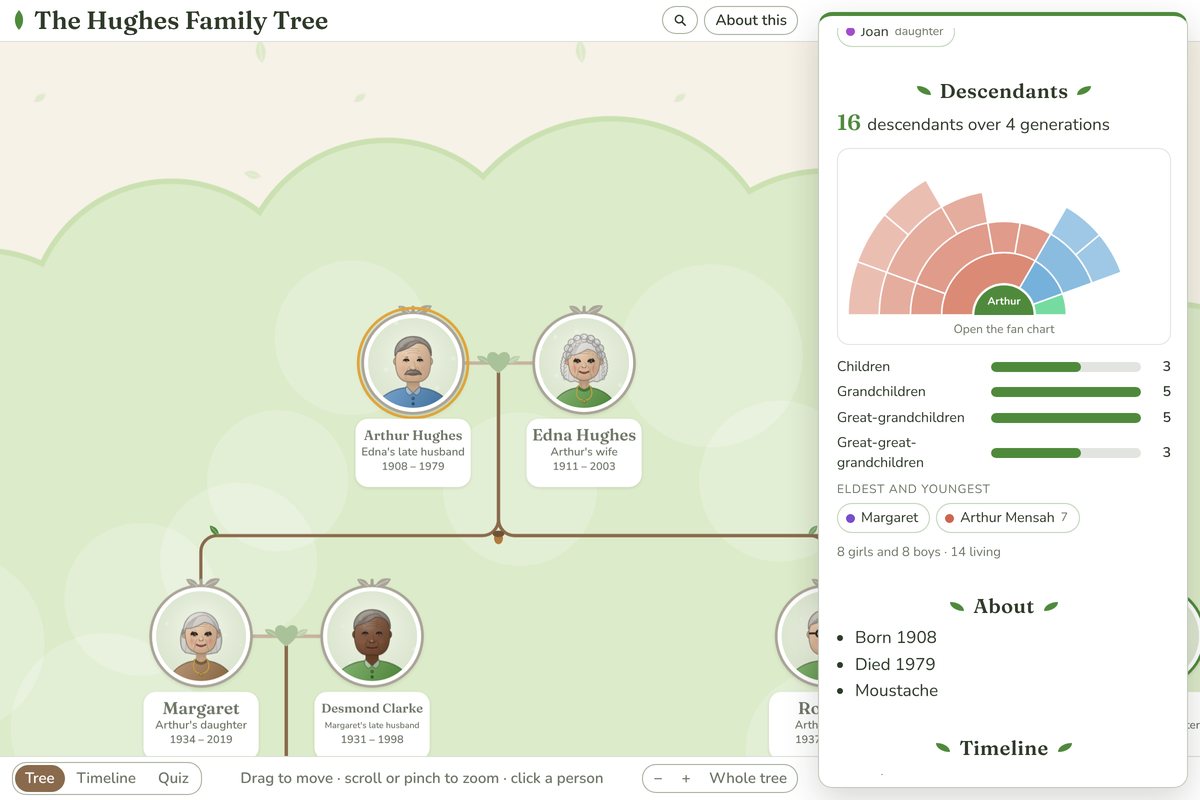
Click the fan to open it full size. Each ring is a generation, with everyone's name on it, and each of their children's branches has its own colour. Click anyone in the fan to see their own panel. The Ancestors button turns it round to show where someone came from instead. For someone with no children yet, the panel shows their ancestors to begin with.
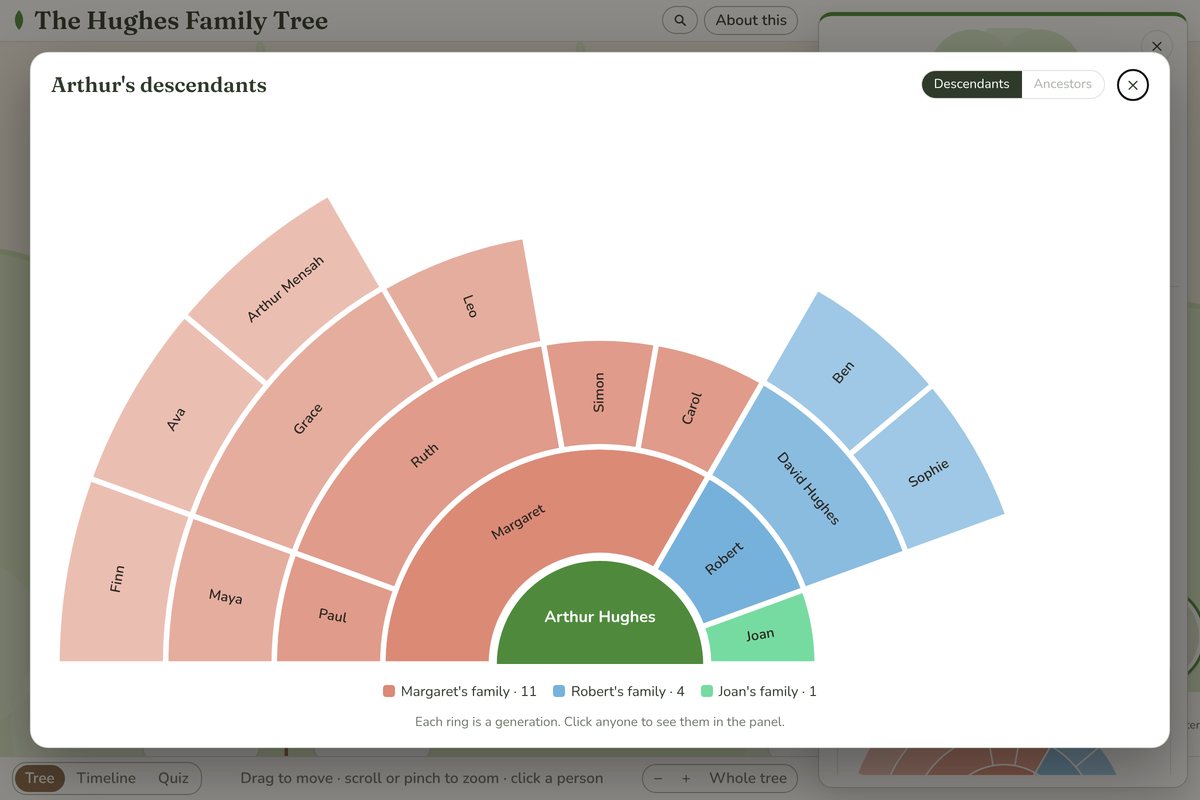
When you print a page about one person (click them, then Print this person), the descendants and fan chart are included. Untick Descendants and fan chart if you'd rather leave them out.
Getting the most from your stats
The stats come from the years in your story, so the more dates you write, the fuller they get:
Edna was born in 1911 and died in 2003.
Maya was born in 1986.
Someone with no year or age still counts as a person, but they won't show in Born in each decade or Lifelines. The chart says how many people have a year, so you can see who's missing.
When you share your tree, Hide ages in Share (under What they see) is on to begin with, to keep living people's birth years private. The people you share with see stats worked out from the years that are shown, so the births chart will be shorter for them than it is for you. Ancestors keep their dates, so lifespans and lifelines still work.
Family stats are in the editor and on shared trees. They aren't in org charts, where lifespans wouldn't mean much.
Open your family tree and click About this to see yours.